Part 1: Metrics Philosophy
The Core Principle
Only look at metrics that help you make decisions.
If you track metrics and create dashboards but don't use them for decision-making, rethink your metrics.
The ROI Reality
From Rand Fishkin (founder of Moz, SparkToro):
"Waste 50% of your budget to get more value from the other 50%"
Accept that not everything is measurable. But still:
- Optimize impact within activities
- Justify budget for programs
- Make arguments for scaling
Part 2: Attribution Fundamentals
The Developer Attribution Challenge
Developers are hard to attribute:
- Long evaluation periods
- Multiple anonymous visits
- Dark social influence
- Word of mouth invisible
- Cookie restrictions
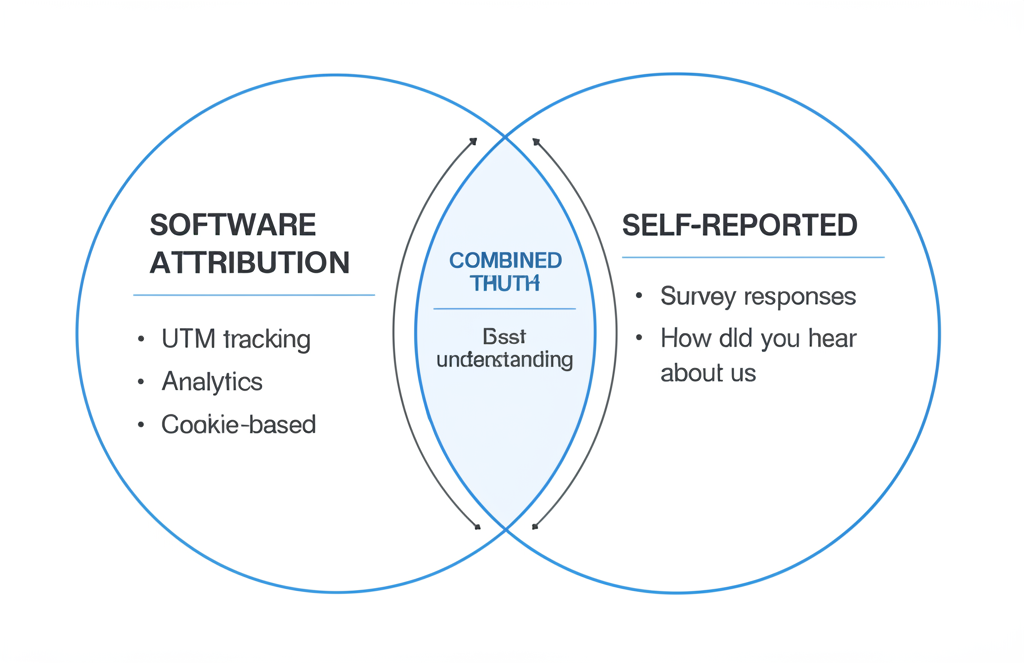
The Attribution Mix
Use both:
- Software attribution: What you can track
- Self-reported attribution: What they tell you
Neither is complete. Together, they're useful.
Part 3: Self-Reported Attribution
Why Self-Reported Matters
Software attribution misses:
- Podcast mentions
- Slack recommendations
- Twitter threads
- Word of mouth
- Conference encounters
Self-reported captures what people remember as influential.
Implementation
When to ask: On signup, during onboarding
How to ask:
- "How did you hear about us?"
- Open text field (better data) vs dropdown (easier analysis)
Advanced Tricks
Fake option method: Add a "fake" channel you're not using (e.g., "billboards"). Gives you a misclick/didn't care baseline to subtract.
Lift tests: Scale one channel for 1-2 weeks while keeping everything else constant. See the real impact (works best for ads).
Part 4: Developer Journey Metrics
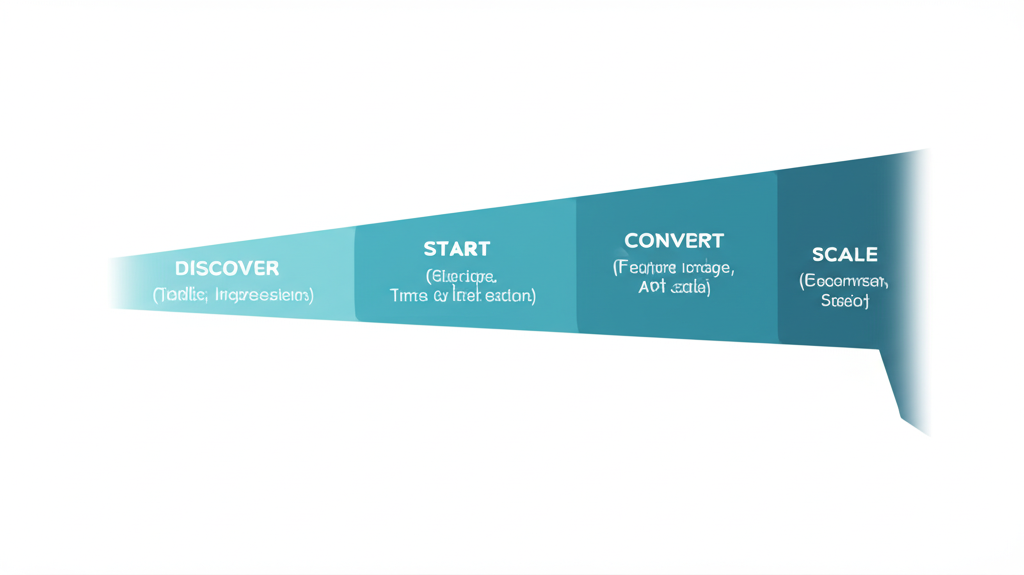
Journey Stages
| Stage | Key Metrics |
|---|---|
| Discover | Traffic, impressions, reach |
| Start | Signups, time to first action |
| Activate | Activation rate, time to first X |
| Convert | Free-to-paid, upgrade rate |
| Scale | Expansion, team size, upsell |
The One Metric to Rule Them All
Time to First Hello World
Measure from signup or website landing. Proxy for how smooth the try-out experience is. Great activation metric candidate.
Stage-Specific Metrics
Discover:
- Website traffic (by source)
- Social reach
- Community mentions
Start:
- Signups (daily, weekly)
- Docs visits
- Quickstart completions
Activate:
- Feature X usage (first time)
- API calls made
- Integration connected
Convert:
- Trial-to-paid conversion
- Time to first payment
- Free-to-team upgrade
Scale:
- Seat expansion
- Usage growth
- Enterprise upgrades
Part 5: Marketing KPIs
What Marketing Should Own
From OpenView research (PLG-focused):
Marketing most often owns:
- Acquisition — Signups, leads
- Self-serve revenue — But not free-to-paid conversion
Why the Split?
Free-to-paid conversion requires:
- Product onboarding
- Docs
- Initial enablement
That feels like product/growth.
Once converted, marketing helps:
- Feature awareness
- Adoption growth
- Usage expansion
Core Marketing Metrics (from Datadog CMO)
- MQLs (awareness proxy when MQL→Opp conversion stable)
- Opportunities
- Pipeline value
- Win rate
Part 6: DevRel and Content Metrics
Measuring DevRel
Resources:
- Developer Advocate's Guide to Metrics
- Devrel KPIs (Orbit)
- Measuring Developer Relations (swyx)
Common metrics:
- Content engagement
- Community growth
- Conference impact
- Developer satisfaction
Content Metrics
Engagement:
- Page views
- Time on page
- Scroll depth
- Social shares
Conversion:
- CTA clicks
- Signups attributed
- Demo requests
Quality:
- Repeat visits
- Newsletter signups
- Community joins
Part 7: Proving Marketing ROI
The Program-Level Approach
Treat marketing programs like products:
- Measure ROI at program level
- Optimize activities within programs
- Don't report ROI on individual activities
Lower Bound ROI Estimation
Estimate based on meaningful outputs:
- Signups
- Demo requests
- High-intent pageviews (pricing, terms, contact)
This gives you a floor, not ceiling.
The Attribution Trick (from Datadog CMO)
With sales, walk through enterprise customer journeys:
- All marketing touches
- All sales engagements
- The full picture
Do this quarterly.
Result: Less fighting about attribution, more appreciation across teams.
Part 8: Docs Metrics
Key Docs Metrics
North Star: Time to first [X]
- Time to first API call
- Time to first dashboard
- Time to first integration
Quality: Customer satisfaction on pages
- 60%+ is good
- Track per-page ratings
- Monitor trends
Search Analytics
Track:
- Most common searches
- Zero-result searches
- Search → bounce sequences
Use to improve content and navigation.
Part 9: Event and Community Metrics
Event ROI
Quantitative:
- Leads captured
- Meetings booked
- Pipeline generated
- Deals closed
Qualitative:
- Conversation quality
- Product feedback
- Competitive intel
Community Metrics
Engagement:
- Daily/weekly active members
- Messages per member
- Response rate to questions
Quality:
- Member retention
- Satisfaction scores
- Content generated
Business:
- Community → customers
- Support deflection
- Referrals sourced
Part 10: Reporting and Dashboards
What to Report
Weekly:
- Signups trend
- Key channel performance
- Active experiments
Monthly:
- Full funnel metrics
- Channel performance
- Content performance
- Budget vs results
Quarterly:
- Pipeline review with sales
- Program ROI
- Channel strategy review
Dashboard Principles
- Actionable: Each metric should inform a decision
- Clear: Anyone can understand it
- Updated: Real-time or daily
- Focused: Don't track everything, track what matters
Quick Reference: Metrics Checklist
Attribution
- Software tracking implemented
- Self-reported attribution on signup
- Combining both in analysis
- Regular attribution reviews
Developer Journey
- Stage definitions clear
- Metrics per stage defined
- Activation metric chosen
- Time to X tracked
Marketing KPIs
- Signups tracked
- Pipeline contribution measured
- Program-level ROI calculated
- Aligned with sales on definitions
Reporting
- Weekly metrics reviewed
- Monthly report produced
- Quarterly strategy review
- Dashboards maintained
Resources & Further Reading
Attribution & ROI
- Rand Fishkin on Marketing ROI — Accept 50% budget waste reality
- Datadog CMO on Attribution — Lenny's Podcast
- FIRE Framework for Measuring Content Marketing — Jared Waxman
Developer Metrics
- Developer Advocate's Guide to Metrics — Mary Thengvall
- DevRel KPIs (Orbit) — Metrics that matter
- Measuring Developer Relations — swyx
PLG Metrics
- OpenView PLG Benchmarks — What marketing should own
- Product-Led Geek Newsletter — Ben Williams (activation metrics)
- Alternative to NPS for Dev Tools — boldstart.vc